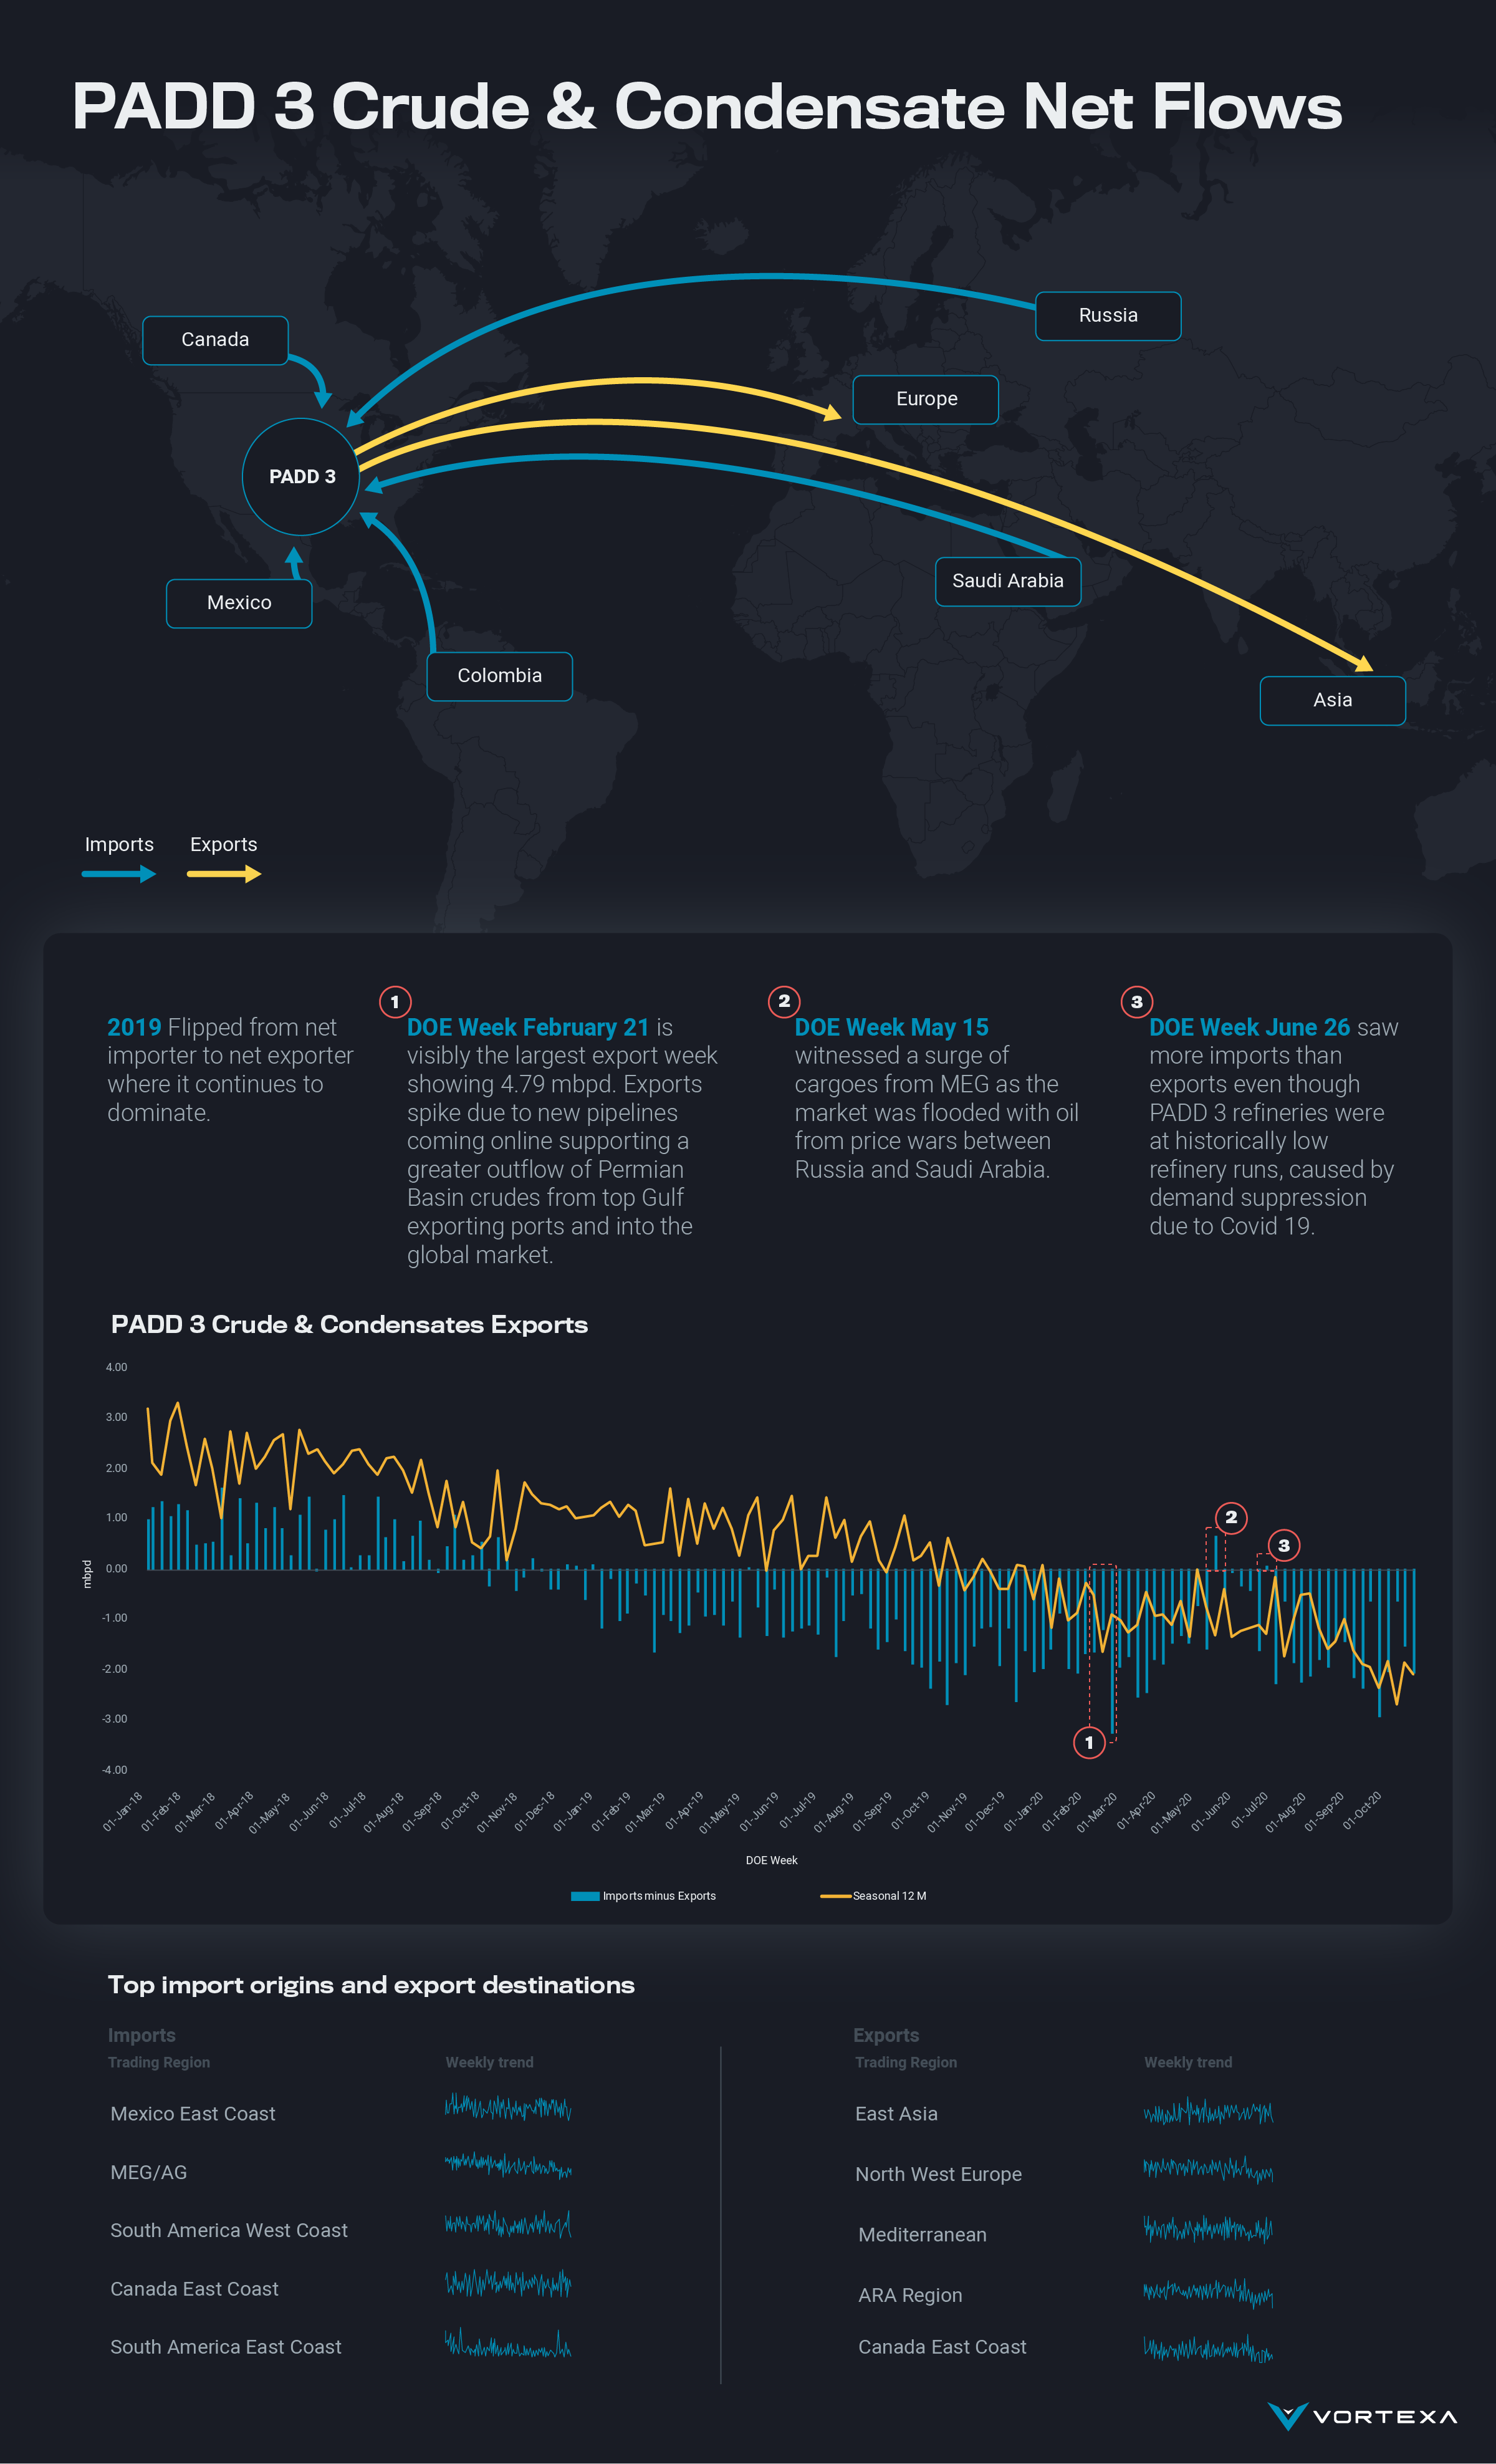
Featuring Vortexa Net Flows – PADD 3 Crude Flows Infographic
Introducing Vortexa net flows analytics with an Infographic on European diesel net flows
17 November, 2020

Click to zoom
Key Benefits of the Vortexa Net Flows screen
- Analyse real-time changes on net seaborne flows
- Identify at a glance whether regions are over or under supplied, and reposition your trading strategy accordingly
- Discover longer term trends in seaborne flows and identify alternative markets
Recent Net Flows Analysis
- Mediterranean road fuel flows in flux (October 29, 2020)
- European Diesel Net Flows Infographic (November 6, 2020)
- LinkedIn – What’s the quickest way to quantify a product balance anywhere in the world? (November 12, 2020)
Explore our net flows analytics today
{{cta(‘bed45aa2-0068-4057-933e-3fac48417da3′,’justifycenter’)}}